> ## Documentation Index
> Fetch the complete documentation index at: https://docs.proddyai.app/llms.txt
> Use this file to discover all available pages before exploring further.
# Reports
> The Reports and Analytics tab tracks workspace activity and performance metrics. It gives you a summary of your activity, task completion, and other performance metrics. It is an effective tool to analyse your work trends and keep track of your workspace.
 NOTE: This option is available only for workspace owners and administrators. To learn more on granting administrator access, click here.
**How to access it?**
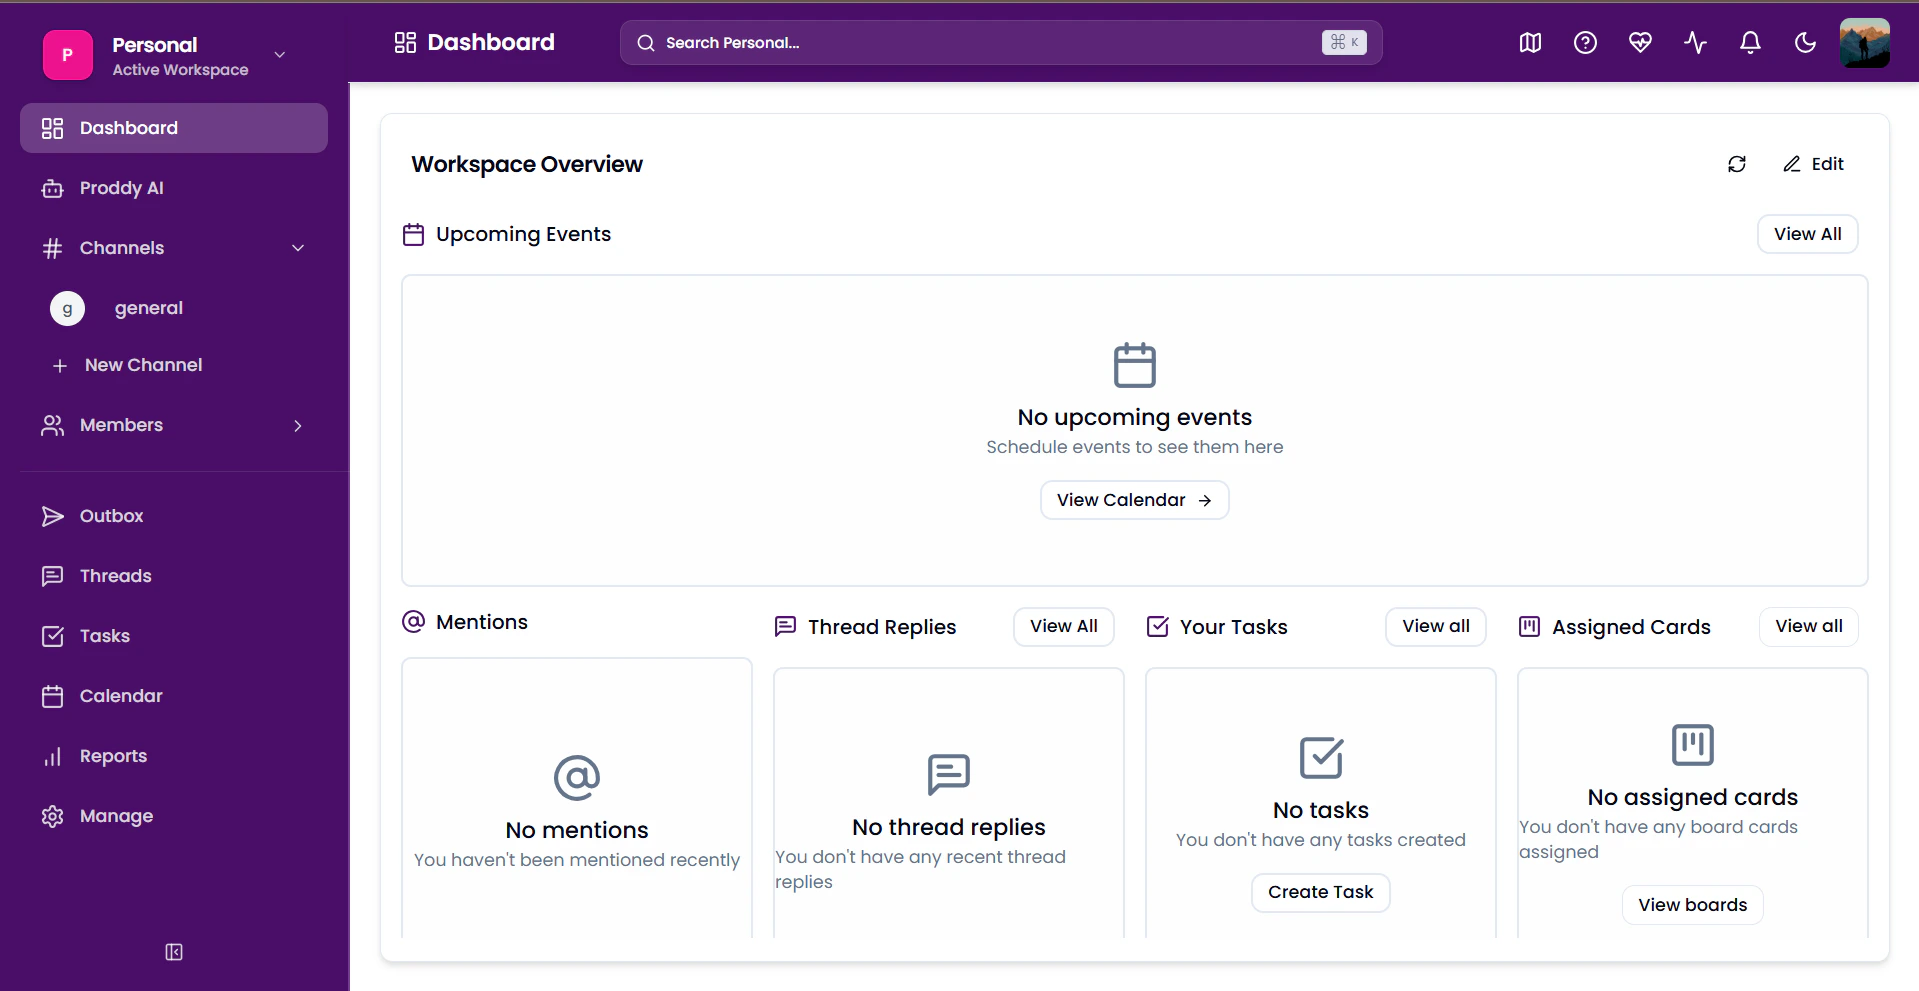
Reports is available in the sidebar of your workspace.
1. Expand the sidebar.
2. Click on Reports \*\*to open the \*\*Reports & Analytics page.
NOTE: This option is available only for workspace owners and administrators. To learn more on granting administrator access, click here.
**How to access it?**
Reports is available in the sidebar of your workspace.
1. Expand the sidebar.
2. Click on Reports \*\*to open the \*\*Reports & Analytics page.
 ### **Report Tabs**
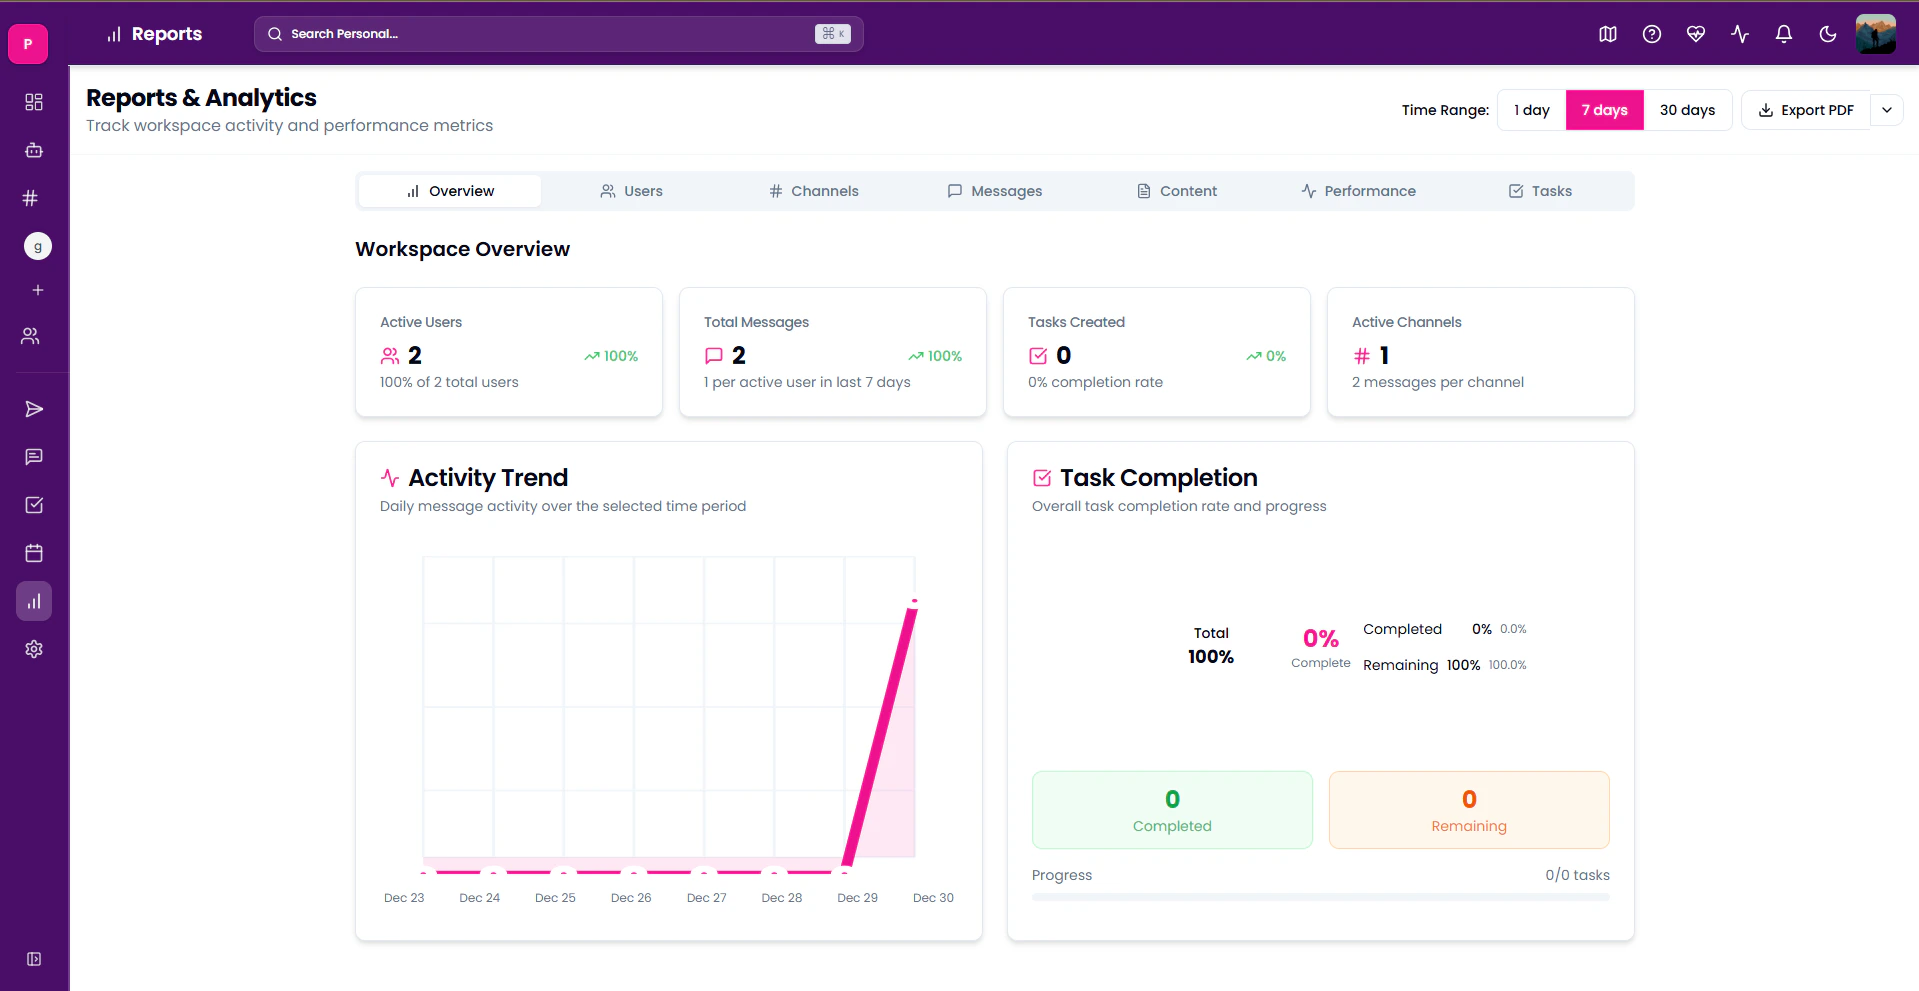
**Workspace Overview**
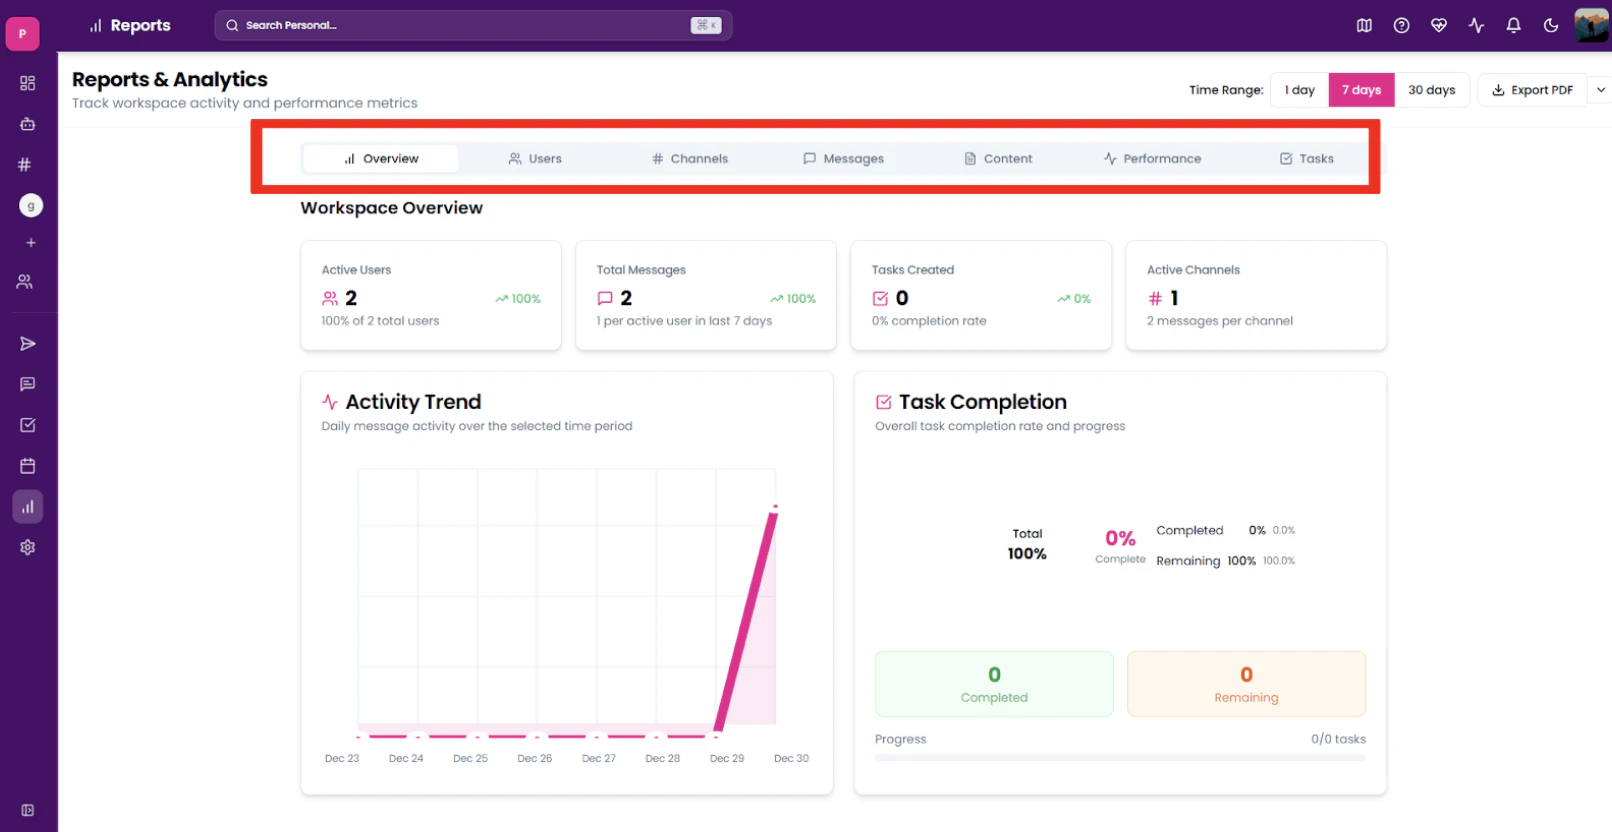
This tab gives a general overview of all the statistics. This includes data on the number of users, messages sent, tasks created, and active channels and also shows progress regarding each member's task completion.
It also gives a diagrammatic description of daily messaging activity inside the workspace.
### **Report Tabs**
**Workspace Overview**
This tab gives a general overview of all the statistics. This includes data on the number of users, messages sent, tasks created, and active channels and also shows progress regarding each member's task completion.
It also gives a diagrammatic description of daily messaging activity inside the workspace.
 ### **User Activity**
To access the Users tab:
1. Open the **Reports & Analytics** page.
Select Channels rom the given tab menu
### **User Activity**
To access the Users tab:
1. Open the **Reports & Analytics** page.
Select Channels rom the given tab menu
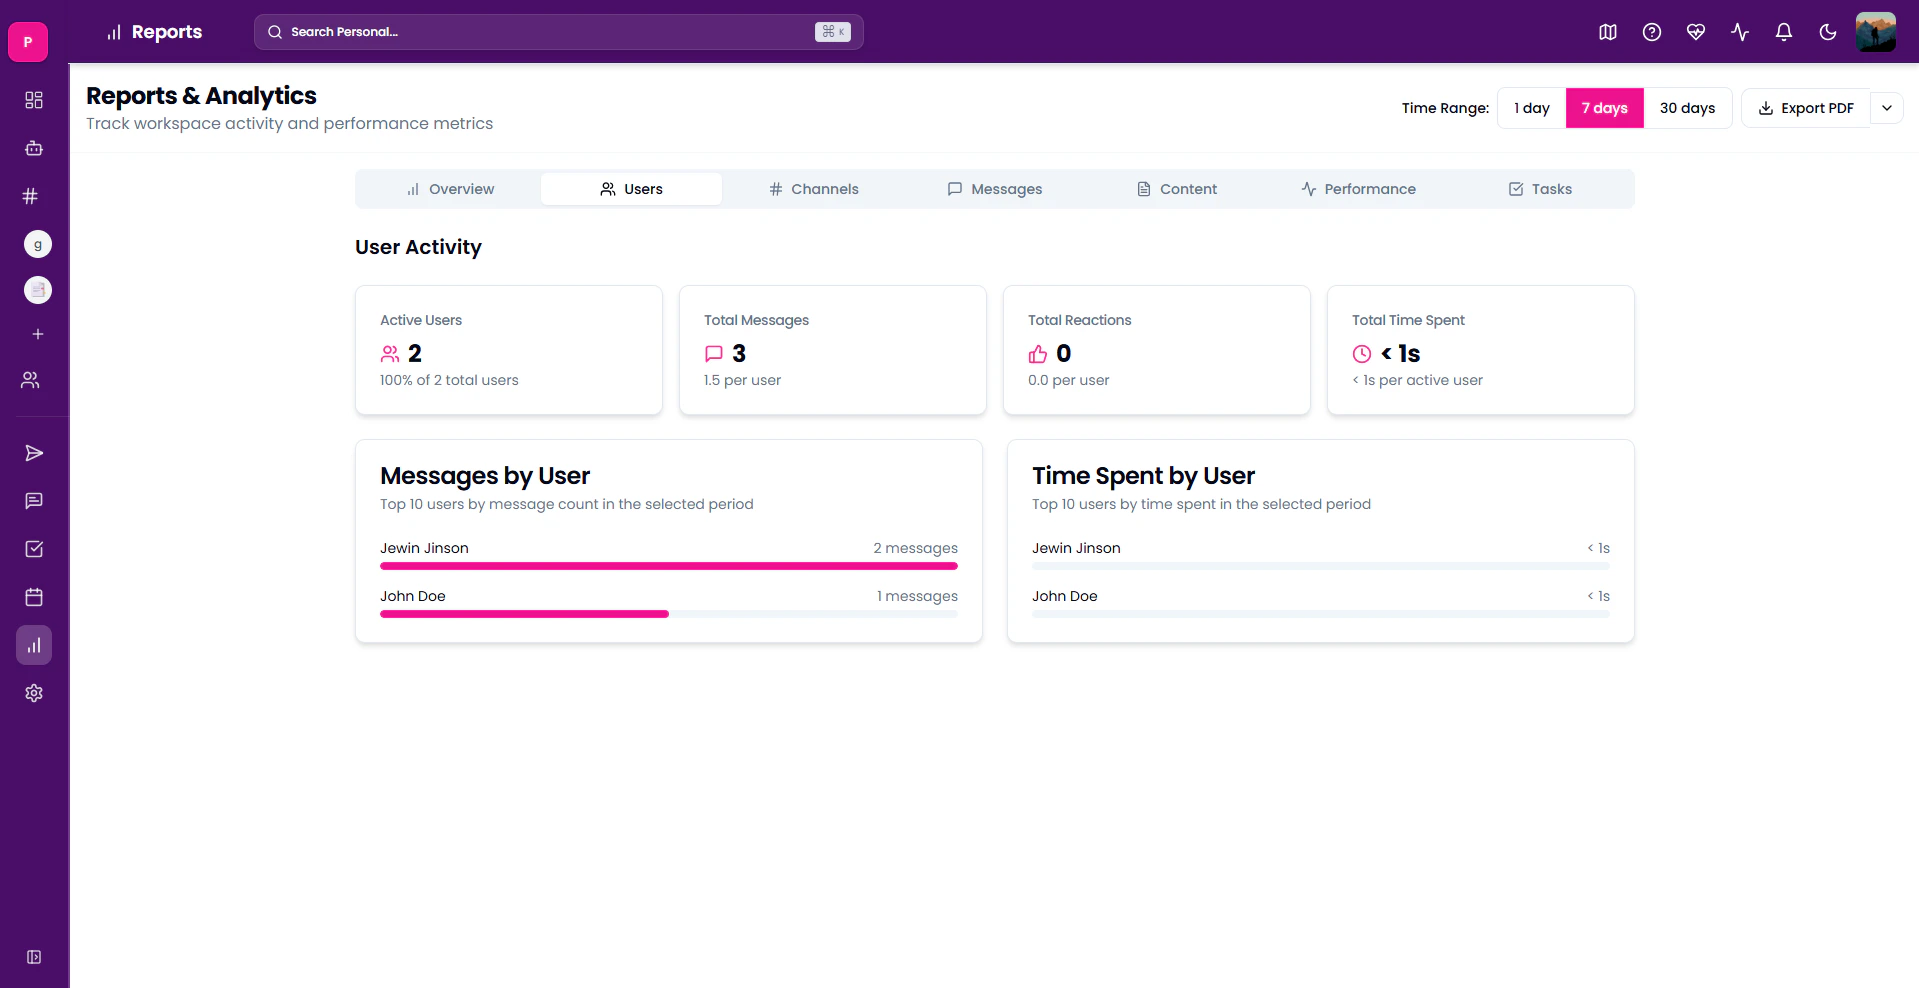 This tab gives in-depth details on each user's statistics. This includes the time spent on the workspace by each user.
**Channel Activity**
This tab shows statistics related to channel activity, including total messages sent. It categorises messages by channel, highlights the most active channel and provides much more insight into team participation in channels.
To access it
1. Open **Reports & Analytics** Page
2. Select Channels from the given tab menu.
This tab gives in-depth details on each user's statistics. This includes the time spent on the workspace by each user.
**Channel Activity**
This tab shows statistics related to channel activity, including total messages sent. It categorises messages by channel, highlights the most active channel and provides much more insight into team participation in channels.
To access it
1. Open **Reports & Analytics** Page
2. Select Channels from the given tab menu.
 ## **Messages**
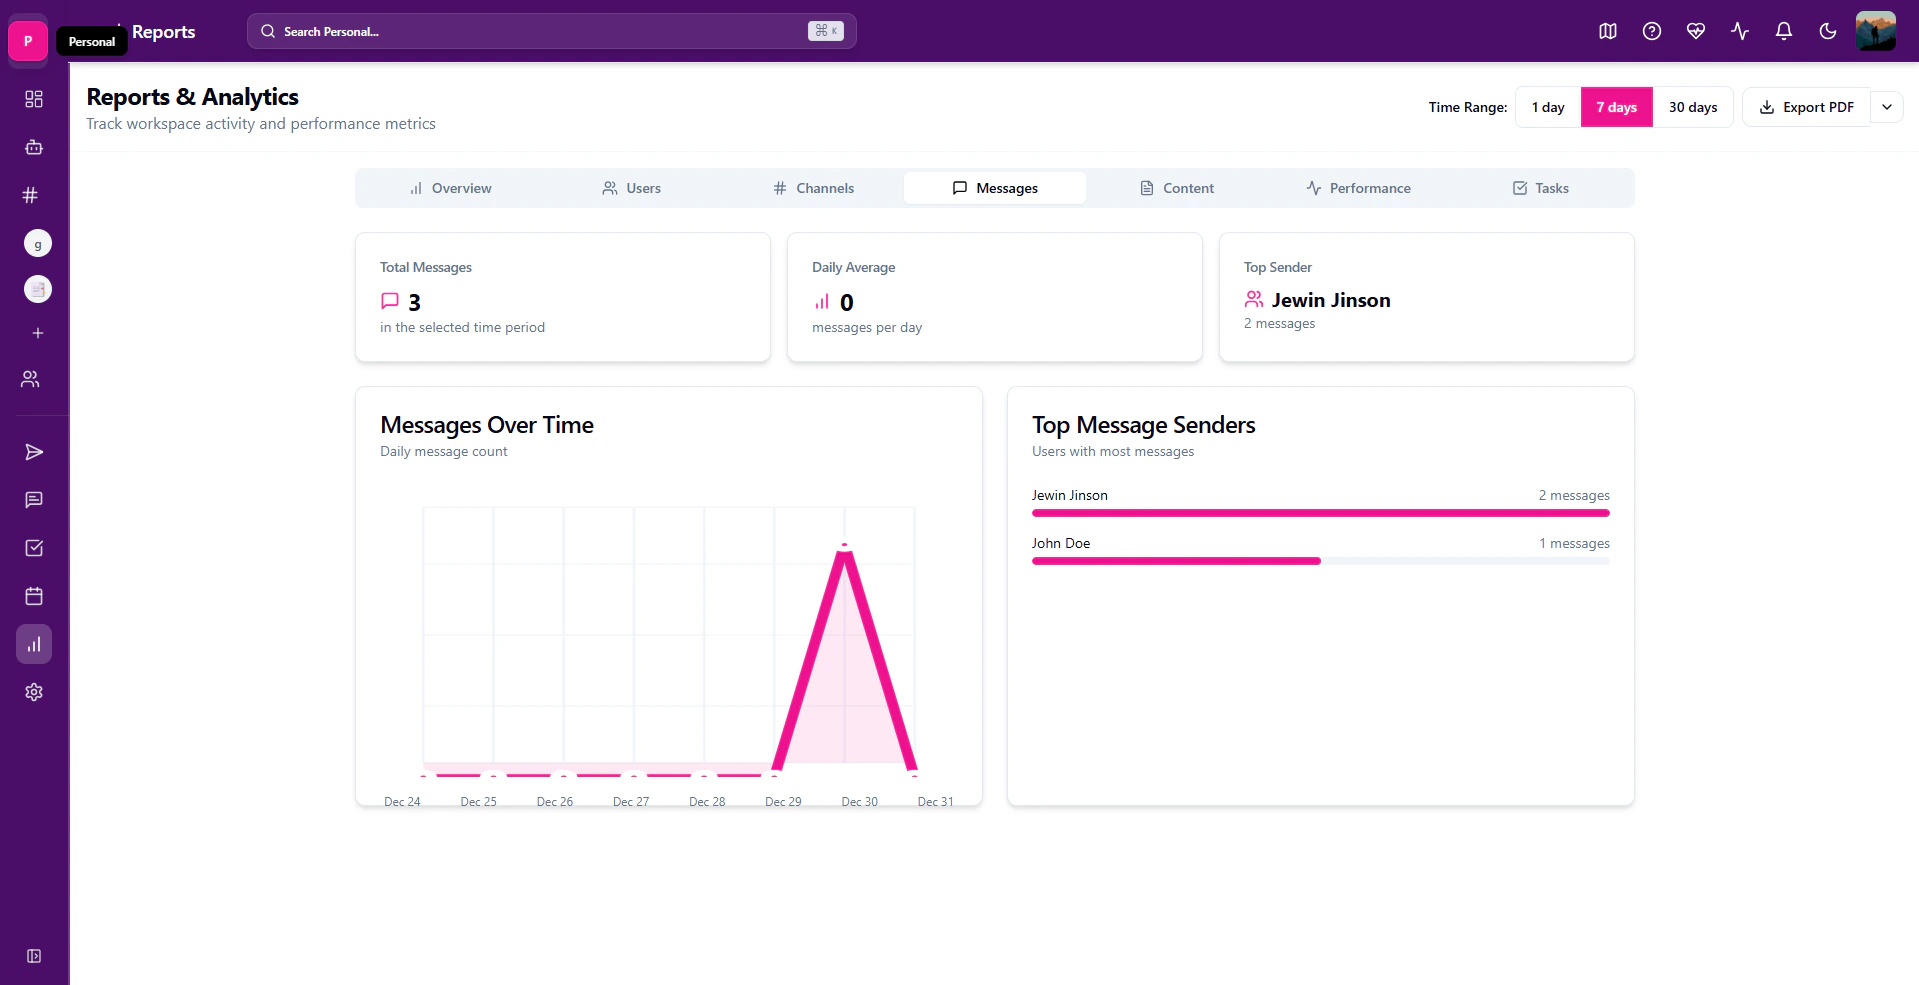
This tab provides insights into data regarding messages shared in the workspace. It effectively summarises the data regarding conversation in the workspace.
## **Messages**
This tab provides insights into data regarding messages shared in the workspace. It effectively summarises the data regarding conversation in the workspace.
 To access it:
1. Open Reports & Analytics Page
2. Select Messages from the given tab menu.
## **Content**
This tab displays details regarding content shared inside the workspace. It provides insights into files shared and activity patterns.
To access it:
1. Open Reports & Analytics Page
2. Select Content from the given tab menu
You can also choose to see statistics regarding messages, files or activity patterns. To do so, select the required option from the given tabs.
**Performance Metrics**
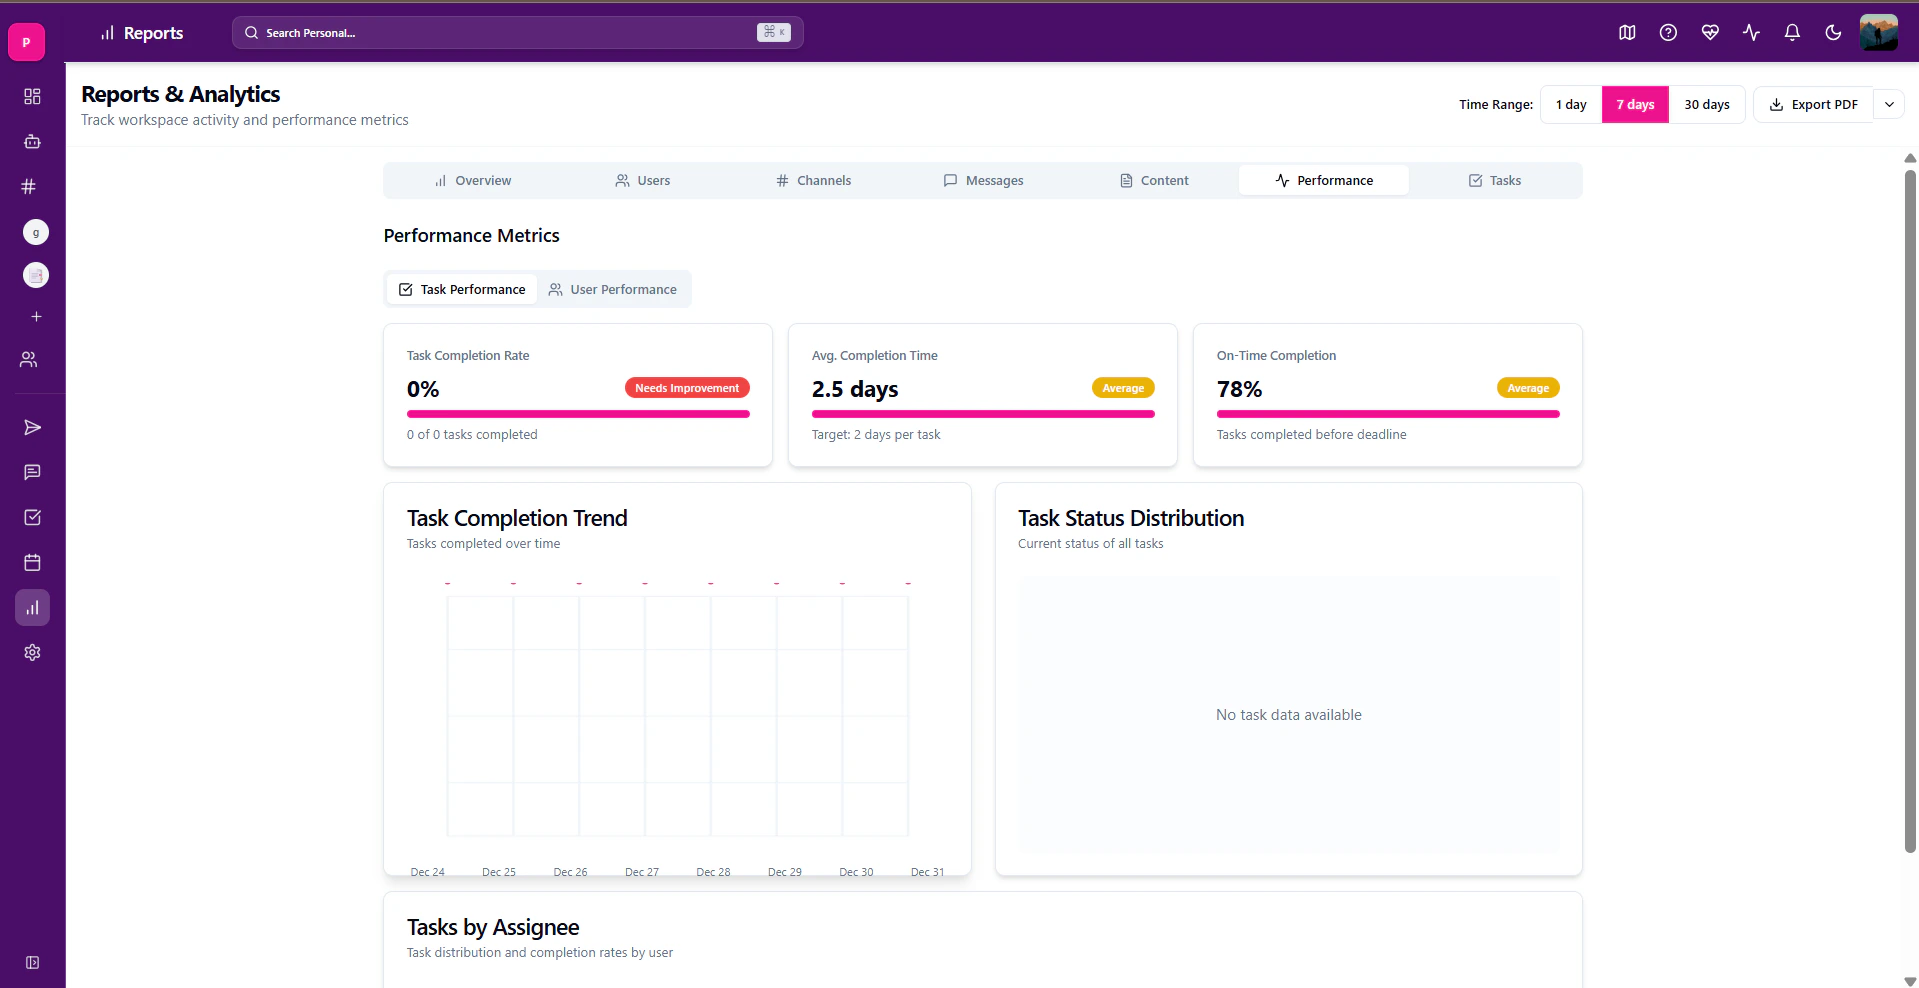
This tab documents user task completion, completion time and related statistics. It gives insights into your team's effective work done by considering the time taken for task completion and the number of tasks assigned.
To access it:
1. Open Reports & Analytics Page
2. Select Messages from the given tab menu.
## **Content**
This tab displays details regarding content shared inside the workspace. It provides insights into files shared and activity patterns.
To access it:
1. Open Reports & Analytics Page
2. Select Content from the given tab menu
You can also choose to see statistics regarding messages, files or activity patterns. To do so, select the required option from the given tabs.
**Performance Metrics**
This tab documents user task completion, completion time and related statistics. It gives insights into your team's effective work done by considering the time taken for task completion and the number of tasks assigned.
 To access it:
1. Open Reports & Analytics Page
2. Select Performance from the given tab menu
### **Tasks**
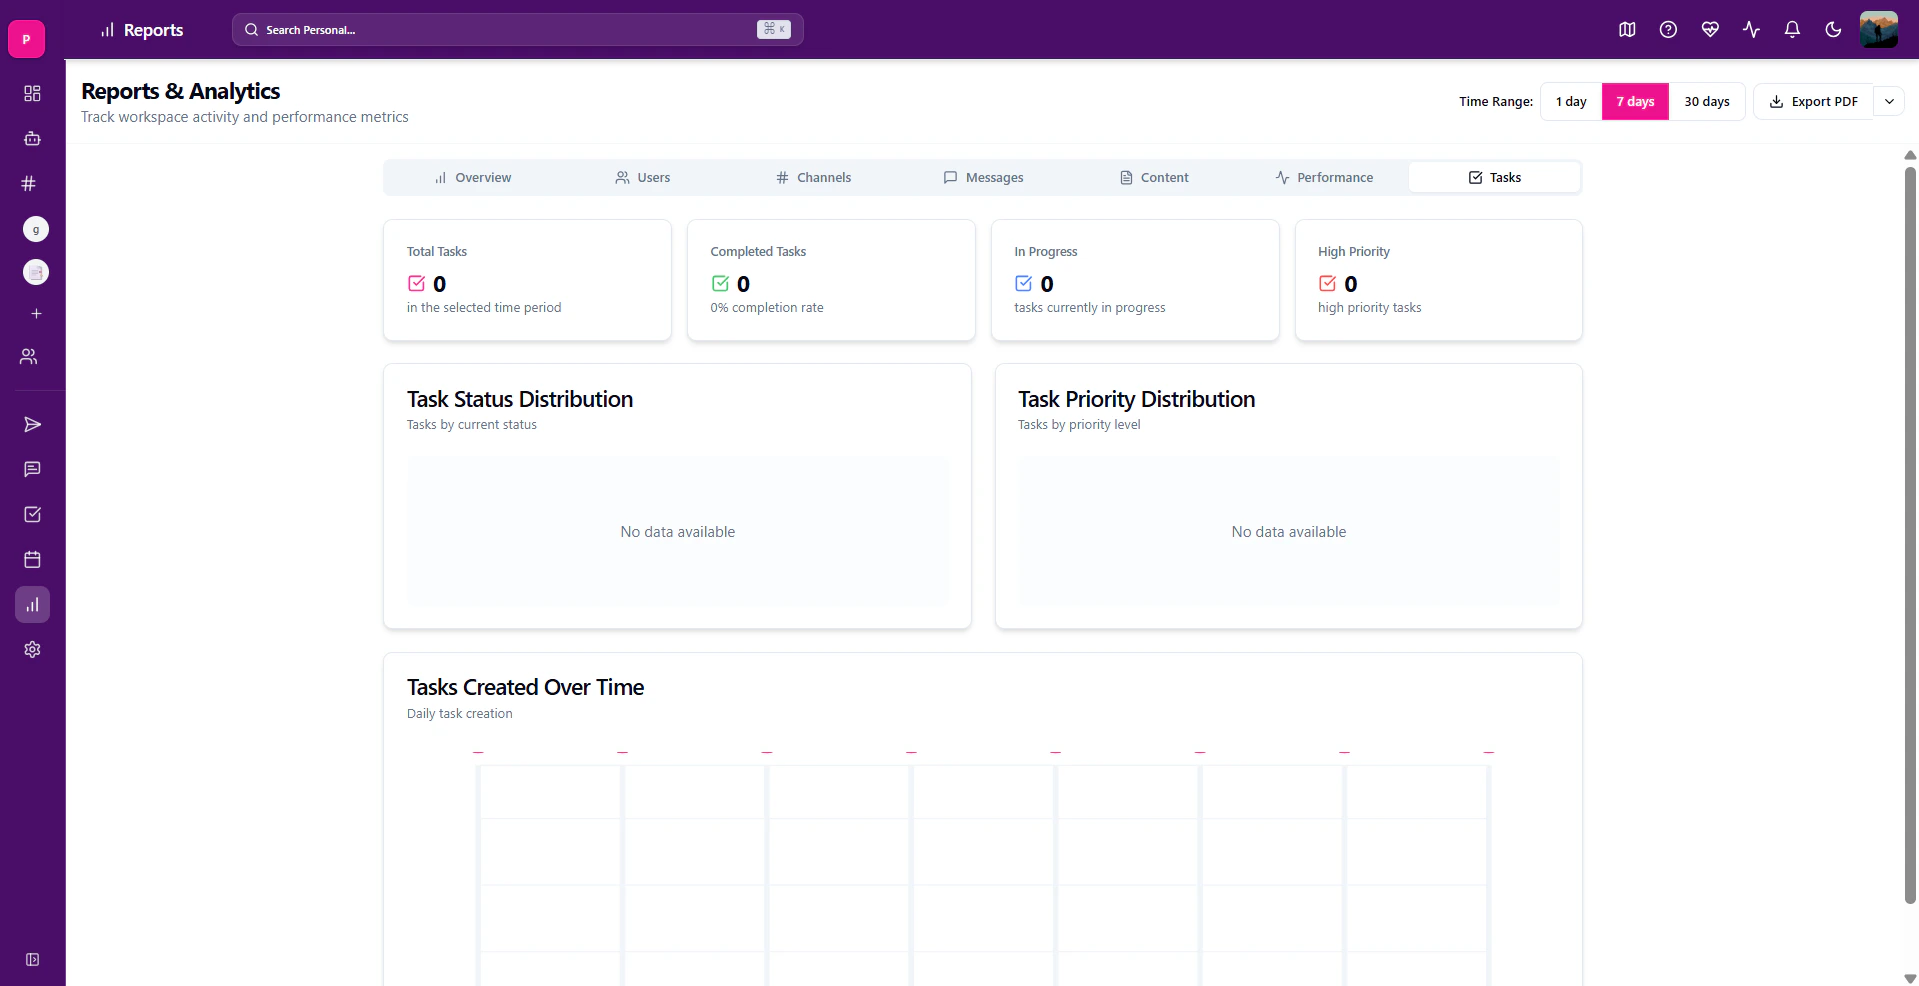
This tab shows statistics-related tasks in the workspace. It shows tasks under various levels of completion. It also gives a diagrammatic representation of data for better understanding.
To access it:
1. Open Reports & Analytics Page
2. Select Performance from the given tab menu
### **Tasks**
This tab shows statistics-related tasks in the workspace. It shows tasks under various levels of completion. It also gives a diagrammatic representation of data for better understanding.
 To access it
1. Open Reports & Analytics Page
2. Select Tasks from the given tab menu
### **Changing Time Range**
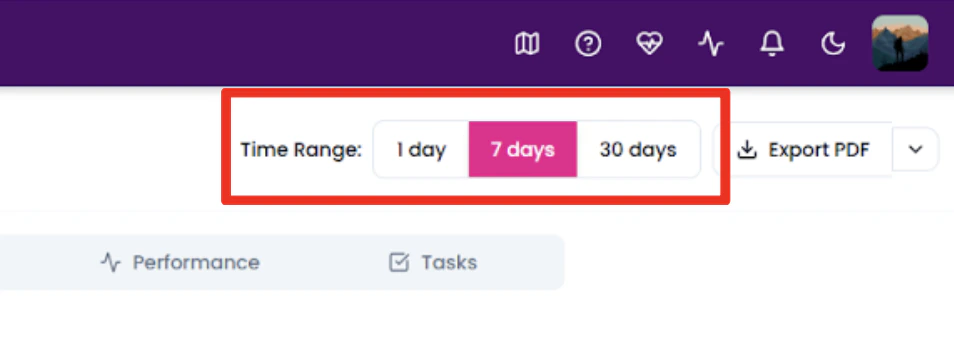
You can adjust the time range to see your statistics during your preferred time. To adjust it, first open the **Reports** tab. Then select from either 1 day, 7 days, or 30 days to see statistics for that time period.
By default it shows data for a 7-day period.
To access it
1. Open Reports & Analytics Page
2. Select Tasks from the given tab menu
### **Changing Time Range**
You can adjust the time range to see your statistics during your preferred time. To adjust it, first open the **Reports** tab. Then select from either 1 day, 7 days, or 30 days to see statistics for that time period.
By default it shows data for a 7-day period.
 ### **Export Report Details**
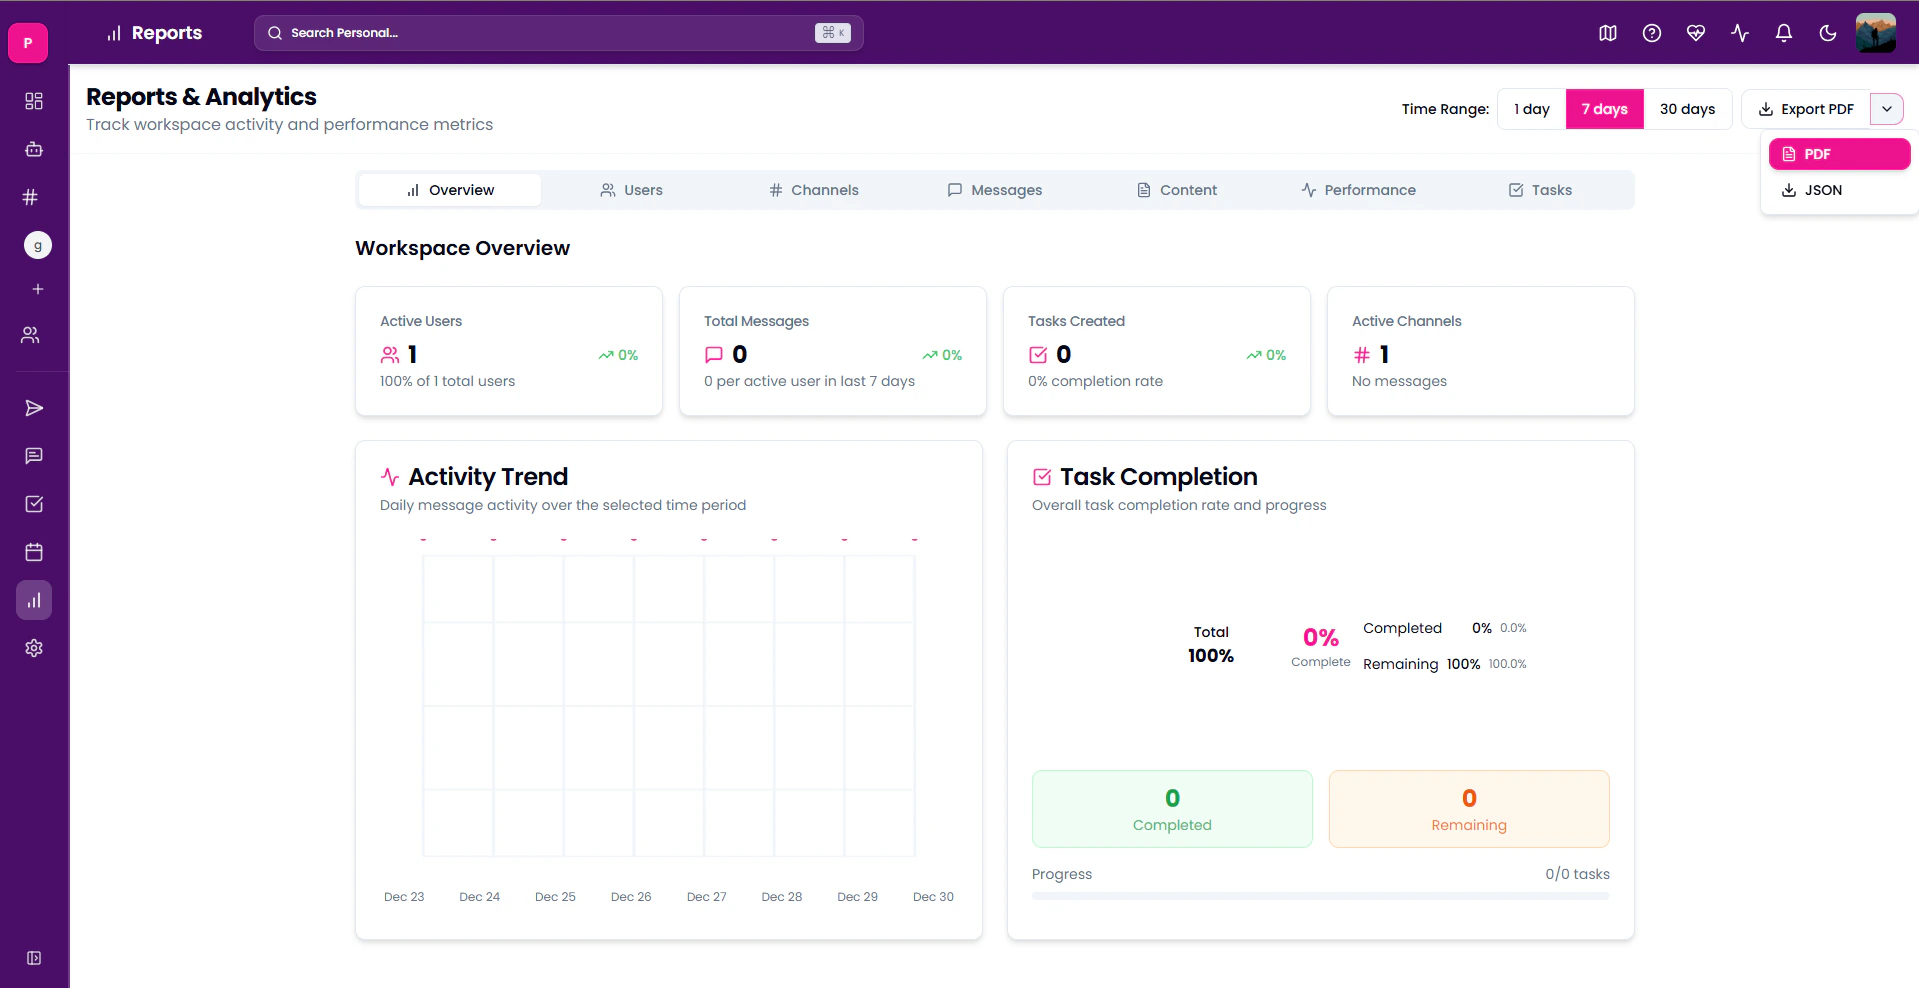
You can also download your **Reports & Analytics** to your computer. This can be done in two ways:
**Exporting as PDF**
To export as a PDF:
1. Open the \*\*Reports & Analytics \*\*page.
2. Find and click on the **Export PDF** option at the top right of the page
### **Export Report Details**
You can also download your **Reports & Analytics** to your computer. This can be done in two ways:
**Exporting as PDF**
To export as a PDF:
1. Open the \*\*Reports & Analytics \*\*page.
2. Find and click on the **Export PDF** option at the top right of the page
 ### **Exporting as JSON file**
To export as a JSON file:
1. Open the Reports & Analytics page.
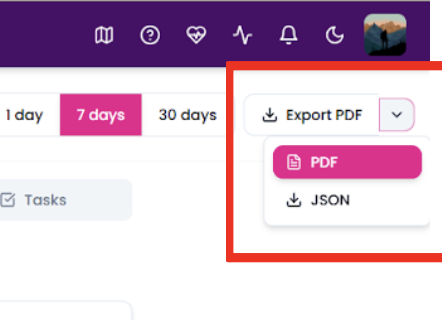
2. Open the dropdown menu right next to the **Export PDF** option.
3. Select JSON from the dropdown menu.
### **Exporting as JSON file**
To export as a JSON file:
1. Open the Reports & Analytics page.
2. Open the dropdown menu right next to the **Export PDF** option.
3. Select JSON from the dropdown menu.